CASE STUDY · CONCEPT UI
Insurance Data Pipeline & Operations Dashboard
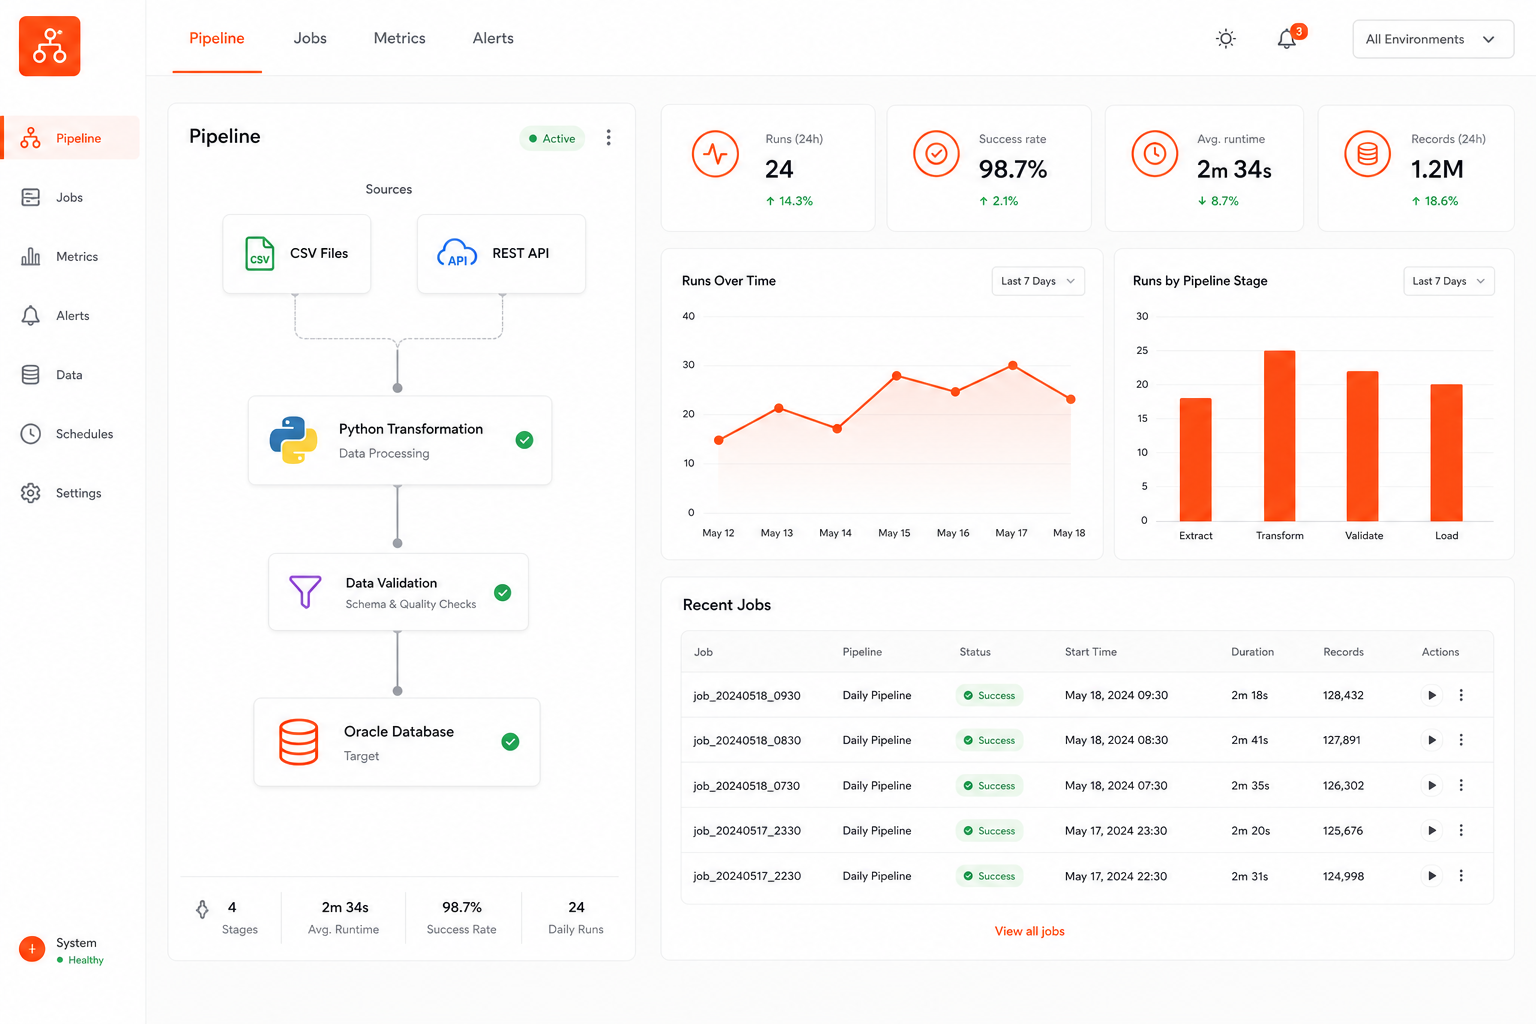
A traceable workflow connecting Python transformations, an Oracle warehouse, and decision-ready Power BI metrics.
THE CHALLENGE
Work backward from outcomes.
10+ automation scripts, ~70% less manual processing, and 15+ tracked metrics. This case study turns those real outcomes into an explainable product flow and concept interface.
ARCHITECTURE
System thinking
01Sources→
02Python / Pandas→
03Oracle SQL→
04Power BI
This is a portfolio concept. The interface, architecture, and demo repository communicate engineering thinking; they are not a shipped commercial product.